
This webpage highlights the state’s homeowners insurance market, from county-level data to statewide averages. You'll also find information about the rate process and Texas’ insurers of last resort.
Texas homeowners insurance market overview
Market snapshot
Active policies: 8,233,096
(2025)
Average annual premium: $3,291
(Homeowners – 2024)
Average filed rate request for 30-day period: -5.3%
(April 2026)
Direct written premium: $19.75 billion
(2025)
Number of insurers: 157 companies; 81 groups
(Do you know the difference between insurance company and insurance group?)
Average filed rate request for 90-day period: 0.6%
(February - April 2026)
Unless noted, above data includes homeowners, renters, condo and mobile home policies.
Texas has a competitive homeowners insurance marketplace, with nearly 160 companies selling homeowners insurance policies in the state.
Source: Texas Statistical Plan for Residential Risks
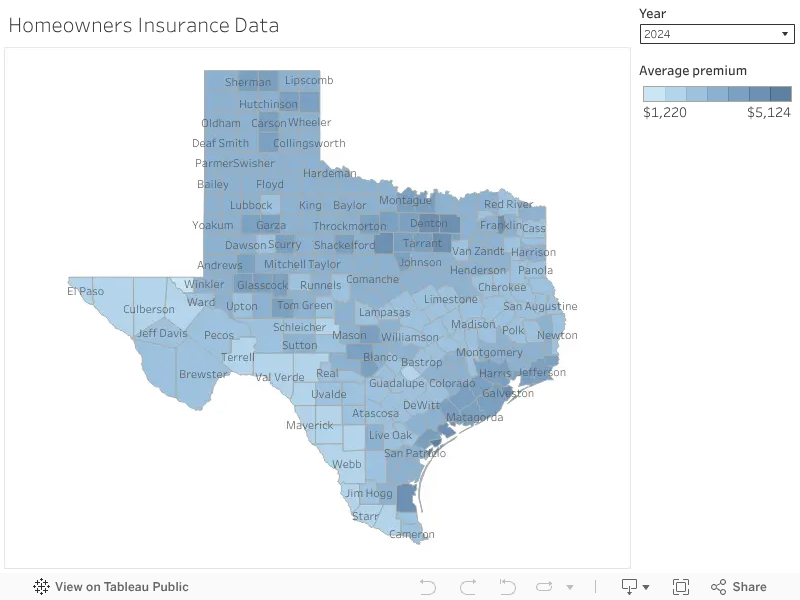
Map info
- Map shows data for homeowners policies active as of 12/31 of the selected year. Use the drop-down menu to select the year of data to display.
- Average premium (with wind): Average annual premium for policies that have wind coverage.
- Policies (with wind): The number of policies that include wind coverage.
- Average coverage: Average insured property amount for policies that include wind coverage.
- Companies: The number of companies collecting premium payments.
- Average FAIR premium: The average annual premium for FAIR policies (doesn’t include wind coverage where TWIA coverage is available).
- FAIR policies: The number of FAIR policies.
Texas Windstorm Insurance Association (TWIA) policies provide wind coverage for property located in 14 coastal counties and parts of Harris County east of Highway 146.
The counties are Aransas, Brazoria, Calhoun, Cameron, Chambers, Galveston, Jefferson, Kenedy, Kleberg, Matagorda, Nueces, Refugio, San Patricio and Willacy. When property is located inside the city limits and east of Highway 146, these portions of Harris County are also included: La Porte, Morgan’s Point, Pasadena, Seabrook, and Shore Acres.
For these counties and areas, the map also shows:
- Average premium (no wind): Average annual premium for policies that don’t have wind coverage.
- Policies (no wind): The number of policies that don’t have wind coverage.
- Average TWIA premium: The average annual premium for TWIA policies.
- TWIA policies: The number of TWIA policies.
Map data
To get data, select the download icon on the bottom right of the above toolbar.
Insurance rates and premiums

What’s the difference between a premium and a rate?
Premium: The amount you pay to an insurance company for an insurance policy.
Rate: The cost of insurance per exposure unit ($1,000 of home coverage or one year of auto coverage).
Example: A gallon of gas costs $3.50. I pay $49 to fill up my car’s 14-gallon gas tank. The premium is $49. It’s the rate ($3.50) times the unit (14 gallons).
How are your auto and homeowners insurance costs calculated?
Average coverage amount

Source: Texas Statistical Plan for Residential Risks
Not only do rate changes affect premiums, but coverage amounts do, too.
Average annual premium

Source: Texas Statistical Plan for Residential Risks
Types of policies: Homeowners
Annual insured losses in billions

Source: Texas Statistical Plan for Residential Risks
Type of policy: Homeowners
What perils cause the most homeowners paid losses?
Data shows loss by quarter, in billions.

Chart data. 2016: Water / freeze, 677.72 Fire, 590.77 Wind, 814.79 Hail, 4605.63, Other, 227.08; 2017: Water / freeze, 791.43 Fire, 591.98 Wind, 1557.85 Hail, 3319.21, Other, 256.88; 2018: Water / freeze, 879.42 Fire, 591.04 Wind, 650.92 Hail, 2133.91, Other, 223.76; 2019: Water / freeze, 828.29 Fire, 683.76 Wind, 1215.72 Hail, 2733.75, Other, 230.95; 2020: Water / freeze, 838.23 Fire, 719.95 Wind, 1163.92 Hail, 2553.16, Other, 282.39; 2021: Water / freeze, 4748.66 Fire, 912.24 Wind, 759.76 Hail, 3509.19, Other, 389.38; 2022: Water / freeze, 1658.87 Fire, 1026.93 Wind, 847.41 Hail, 2646.84, Other, 342.11; 2023: Water / freeze, 1934.75 Fire, 1077.71 Wind, 1217.6 Hail, 4853.17, Other, 400.63; 2024: Water / freeze, 1610.89 Fire, 1091.81 Wind, 2210.03 Hail, 4932.98, Other, 362.16; 2025: Water / freeze, 721.55 Fire, 614.35 Wind, 757.09 Hail, 2324.34, Other, 186.88;
Source: Texas Statistical Plan for Residential Risks
Type of policy: Homeowners
Learn more: Will my premium go up if I file a claim?
Average rate change

Source: TDI rate filing data
Types of policies: Homeowners, renters, condo and mobile homeowners
Rate review process and filings

- Rate review overview
- Find a rate filing
- View rate filing on the System for Electronic Rates and Forms Filing (SERFF)
Annual loss and combined ratios
Two important measures of the financial health of the insurance market are the loss ratio and the combined ratio.
- Loss ratio: Percentage of losses insurers have paid or will pay versus what they have collected in premiums.
- Combined ratio: Combines the loss ratio with an expense ratio. The combined ratio takes into account expenses for agent commissions, loss adjustment expenses, overhead and administrative costs, as well as any policyholder dividends. It doesn't take into account investment income.
A combined ratio of 100 is the break-even point; a ratio below 100 indicates an underwriting profit and a ratio above 100 indicates an underwriting loss.
For example, in 2023, the estimated combined ratio for homeowners, is 105.1%. This means that for every premium dollar collected, it took about $1.05 to cover losses and expenses, and the result is an underwriting loss.
| Year | Loss ratio (%) |
Expense ratio (%) |
Dividend ratio (%) |
Combined ratio (%) |
|---|---|---|---|---|
| 2015 | 53.4 | 36.9 | 0.7 | 91.1 |
| 2016 | 87.5 | 36.5 | 0.6 | 124.6 |
| 2017 | 79.7 | 37.8 | 0.6 | 118.1 |
| 2018 | 44.7 | 35.8 | 0.5 | 81.0 |
| 2019 | 66.6 | 35.4 | 0.7 | 102.7 |
| 2020 | 55.8 | 35.9 | 0.6 | 92.2 |
| 2021 | 104 | 37.3 | 0.5 | 141.8 |
| 2022 | 56.6 | 34.3 | 0.4 | 91.3 |
| 2023 | 71.3 | 33.6 | 0.3 | 105.1 |
| 2024 | 64.5 | 33.4 | 0.3 | 98.3 |
| Five-year total | 69.8 | 34.7 | 0.4 | 104.9 |
| 10-year total | 68.4 | 35.4 | 0.5 | 104.3 |
Source: Annual Statement Data
Making sure insurance companies are solvent
When you file an insurance claim, you’re counting on your insurance company having enough money to pay that claim.
TDI’s Financial Regulation Division works to make sure that happens for consumers.
Learn more: TDI tracks insurance companies’ finances to make sure they can pay claims
Insurance groups with the highest market share in Texas
| Insurance group | Direct written premium | Market share |
|---|---|---|
| State Farm Group | $3,771,115,427 | 19.10% |
| Allstate Insurance Group | $3,315,036,551 | 16.79% |
| United Services Automobile Association Group | $2,216,568,957 | 11.22% |
| Farmers Insurance Group | $1,609,124,111 | 8.15% |
| Liberty Mutual Group | $1,195,188,063 | 6.05% |
| Travelers Group | $1,017,100,071 | 5.15% |
| American Family Insurance Group | $786,827,326 | 3.98% |
| Texas Farm Bureau Mutual Group | $481,294,674 | 2.44% |
| Progressive Group | $471,772,934 | 2.39% |
| Iron Family Holdings Group | $470,611,577 | 2.38% |
Source: 2025 Market Conditions Annual Report
Direct written premium is the total amount of premium an insurance company expects to collect for policies issued.
Shopping for insurance and lowering costs
TDI’s advice for consumers
We recommend consumers shop for coverage regularly. You often get the best rates when you’re willing to switch companies.
You can search and compare policies sold in your area on HelpInsure.com.
Ask your company about the discounts they offer. Discounts can help lower your premium. You might be able to get discounts for things like having more than one policy with the same company.
Choose your deductibles wisely. Policies with higher deductibles have lower premiums. But remember that if you choose a higher deductible, you’ll have to pay more out of pocket if you need to make a claim.

Other ways to get home and wind insurance in Texas
If you’re having a hard time finding an insurance company that will sell you a home or windstorm policy, you can turn to residual markets, or a state-designated insurer of last resort.
 FAIR Plan
You can apply for coverage through the Texas FAIR Plan Association if you own a house, townhouse, condo, or manufactured home. The FAIR Plan also sells renters insurance.
To get a policy, you must have been turned down by two insurance companies. You won’t qualify if a company has offered you a policy or renewal.
Texas FAIR Plan Association Overview (PDF) and latest quarter information.
 TWIA
TWIA
The Texas Windstorm Insurance Association (TWIA) sells wind and hail coverage for coastal residents who have been turned down by an insurance company. You can apply for TWIA coverage through your insurance agent.
Texas Windstorm Insurance Association Overview (PDF) and latest quarter information.
For more information, contact: PropertyCasualty@tdi.texas.gov