Skip to Top Main Navigation Skip to Left Navigation Skip to Content Area Skip to Footer
Texas Department of Insurance
Topics:   A B C D E F G H I J K L M N O P Q R S T U V W X Y Z All

Snapshot: Employer Participation in the Texas Workers’ Compensation System, 2022 Estimates

Workers’ Compensation Research and Evaluation Group

Texas enacted the first workers’ compensation laws in 1913, and since then, has held fast to the principle that private-sector employers should be allowed to choose whether to offer workers’ compensation to their employees. Businesses that provide coverage are called “subscribers.” Those that do not are called “non-subscribers.”

The first study in Texas to estimate the percentage of employers that are “non-subscribers” to the Texas workers’ compensation system was done in 1993. This year, the Texas Department of Insurance, Division of Workers’ Compensation’s Research and Evaluation Group worked with The Public Policy Research Institute at Texas A&M University to interview 1,619 year-round private-sector Texas employers.

Read the full report.

Published: April 2023 by the Workers' Compensation Research & Evaluation Group.

Employee Participation in the Texas Workers’ Compensation System: 2022 Estimates

Key findings

Figure 1. Percentage of Texas Private-Sector Employers That Are Subscribers and Texas Employees Employed by Subscribers Employers: 1993 56%, 1995 56%, 1996 61%, 2001 65%, 2004 62%, 2006 63%, 2008 67%, 2010 68%, 2014 67%, 2016 78%, 2018 72%, 2022 75%. Employees: 1993 80%, 1995 79%, 1996 80%, 2001 84%, 2004 76%, 2006 77%, 2008 75%, 2010 83%, 2014 80%, 2016 82%, 2018 82%, 2022 83%.

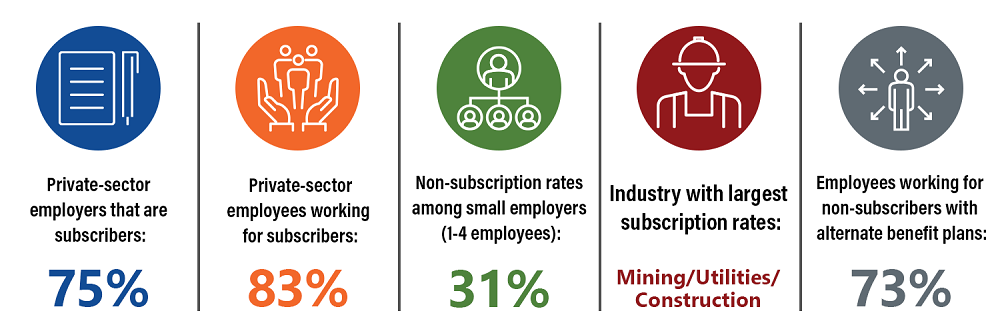
Figure 1 shows that the percentage of Texas private-sector employers that are workers’ compensation subscribers and the percentage of employees who work for a subscriber both increased in 2022. The employer subscription rate increased three percentage points to 75% in 2022 and the percentage of employees working for subscribers (83%) was the highest in 12 years.

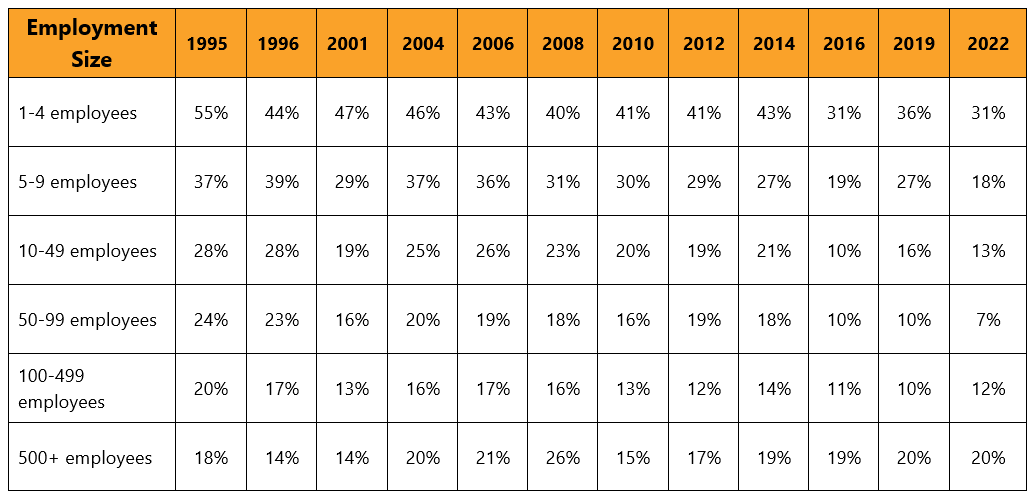
Rates of non-subscription among most employers continues to trend downward. The only category with an increase in non-subscribers was employers with 100-499 employees. Small employers, those with 1-4 employees, had the highest percentage of non-subscribers at 31% in 2022 (Table 1). Employers with 50-99 employees had the lowest percentage of non-subscribers at 7%.

Table 1. Percentage of Texas Private-Sector Employers That Are Non-Subscribers by Employment Size

Table 1. Percentage of Texas Private-Sector Employers That Are Non-Subscribers by Employment Size 1-4 employees: 1995 55%, 1996 44%, 2001 47%, 2004 46%, 2006 43%, 2008 40%, 2010 41%, 2012 41%, 2014 43%, 2016 31%,  2019 36%, 2022 31%. 5-9 employees: 1995 37%, 1996 39%, 2001 29%, 2004 37%, 2006 36%, 2008 31%, 2010 30%, 2012 29%, 2014 27%, 2016 19%, 2019 27%, 2022 18%. 10-49 employees: 1995 28%, 1996 28%, 2001 19%, 2004 25%, 2006 26%, 2008 23%, 2010 20%, 2012 19%, 2014 21%, 2016 10%, 2019 16%, 2022 13%. 50-99 employees: 1995 24%, 1996 23%, 2001 16%, 2004 20%, 2006 19%, 2008 18, 2010 16%, 2012 19%, 2014 18%, 2016 10%, 2019 10%, 2022 7%. 100-499 employees: 1995 20%, 1996 17%, 2001 13%, 2004 16%, 2006 17%, 2008 16%, 2010 13%, 2012 12%, 2014 14%, 2016 11%, 2019 10%, 2022 12%. 500+ employees: 1995 18%, 1996 14%, 2001 14%, 2004 20%, 2006 21%, 2008 26%, 2010 15%, 2012 17%, 2014 19%, 2016 19%, 2019 20%, 2022 20%.

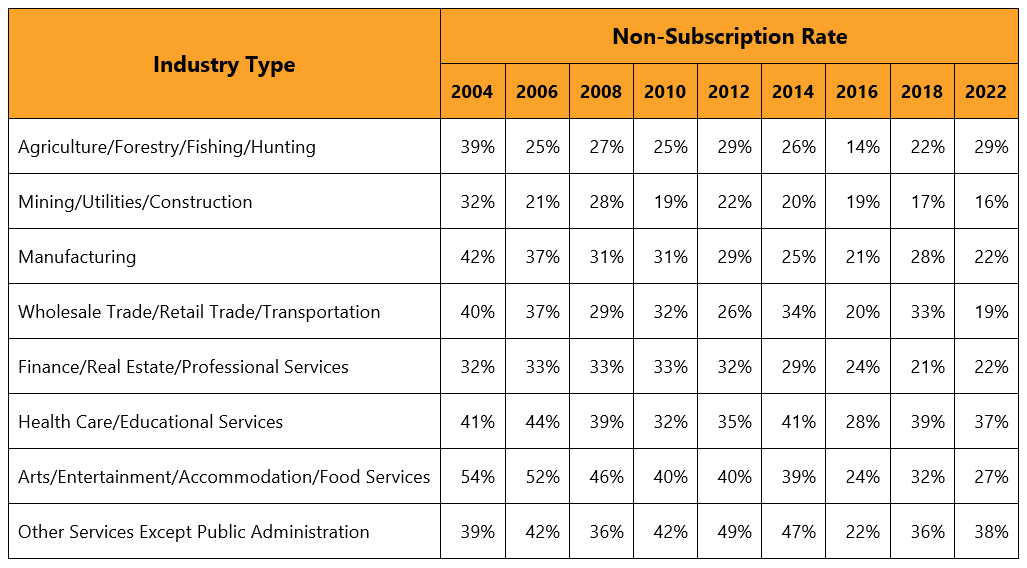
Most industry groups saw a downward trend in non-subscriber rates. Mining/Utilities/Construction continued to have one of the lowest non-subscription rates among all industries, at 16% in 2022. When comparing 2018 to 2022, Wholesale Trade/Retail Trade/Transportation had the largest reduction in the percentage of non-subscribers from 33% to 19%. Agriculture/Forestry/Fishing/Hunting had the largest increase in non-subscriber rates, from 22% in 2018 to 29% in 2022.

Table 2. Percentage of Texas Private-Sector Employers That Are Non-Subscribers by Industry

Table 2. Percentage of Texas Private-Sector Employers That Are Non-Subscribers by Industry Type (non-subscription rate) Agriculture/forestry/fishing/hunting - 2004 39%, 2006 25%, 2008 27%, 2010 25%, 2012 29%, 2014 26%, 2016 14%, 2018 22%, 2022 29%.  Mining/utilities/construction - 2004 32%, 2006 21%, 2008 28%, 2010 19%, 2012 22%, 2014 20%, 2016 19%, 2018 17%, 2022 16%.  Manufacturing - 2004 42%, 2006 37%, 2008 31%, 2010 31%, 2012 29%, 2014 25%, 2016 21%, 2018 28%, 2022 22%.  Wholesale trade/retail trade/transportation - 2004 40%, 2006 37%, 2008 29%, 2010 32%, 2012 26%, 2014 34%, 2016 20%, 2018 33%, 2022 19%.   Finance/real estate/professional services - 2004 32%, 2006 33%, 2008 33%, 2010 33%, 2012 32%, 2014 29%, 2016 24%, 2018 21%, 2022 22%.  Healthcare/educational services - 2004 41%, 2006 44%, 2008 39%, 2010 32%, 2012 35%, 2014 41%, 2016 28%, 2018 39%, 2022 37%.  Arts/entertainment/accommidation/food services - 2004 54%, 2006 52%, 2008 46%, 2010 40%, 2012 40%, 2014 39%, 2016 24%, 2018 32%, 2022 27%.   Other services except public administration - 2004 39%, 2006 42%, 2008 36%, 2010 42%, 2012 49%,  2014 47%, 2016 22%, 2018 36%, 2022 38%.

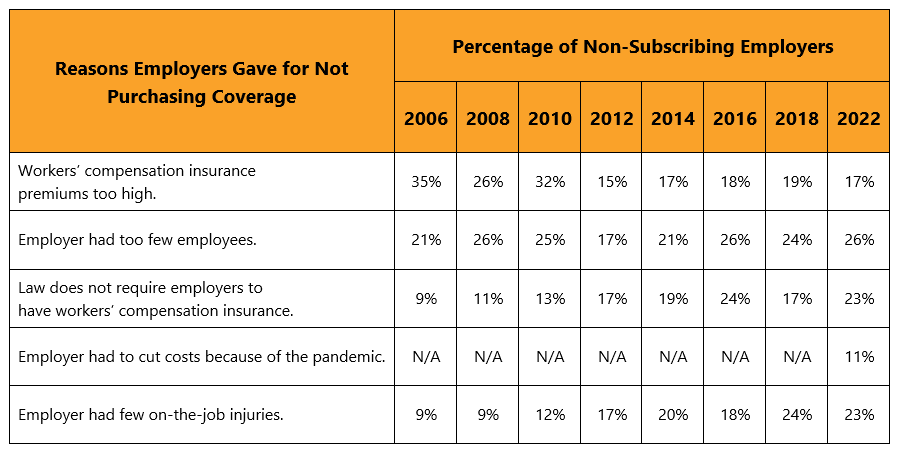
As Table 3 shows, the most frequent reason non-subscribers gave for not purchasing workers’ compensation coverage was that they had too few employees (26%). One of the least frequent reasons that they gave for not purchasing coverage was that premiums were too high.

Table 3. Most Frequent Reasons Non-Subscribers Gave for Not Purchasing Workers’ Compensation Coverage

Table 3. Most Frequent Reasons Non-Subscribers Gave for Not Purchasing Workers’ Compensation Coverage  Workers’ compensation insurance premiums too high. 2006 35%  2008 26%  2010 32%  2012 15%  2014 17%  2016 18%   2018 19%  2022 17%  Employer had too few employees.  20065 21%  2008 26%  2010 25%  2012 17%  2014 21%  2016 26%  2018 24%  2022 26%  Law does not require employers to have workers’ compensation insurance.  2006 9%  2008 11%  2010 13%  2012 17%  2014 19%  2016 24%  2018 17%  2022 23%  Employer had to cut costs because of the pandemic.  2006 N/A  2008 N/A  2010 N/A  2012 N/A  2014 N/A  2016 N/A  2018 N/A  2022 11%  Employer had few on-the-job injuries.  2006 9%  2008 9%  2010 12%  2012 17%  2014 20%  2016 18%  2018 24%  2022 23%

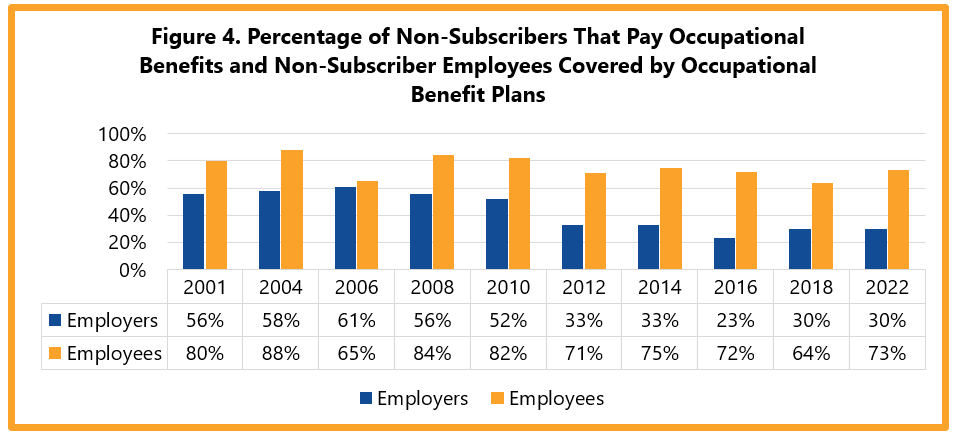
Thirty percent of non-subscribers reported that they have alternative occupational benefits plans for their employees, a percentage that has been fairly stable since 2012. The percentage of non-subscriber employees covered by occupational benefit plans increased to 73% in 2022 from 64% in 2018.

Figure 4. Percentage of Non-Subscribers That Pay Occupational Benefits and Non-Subscriber Employees Covered by Occupational Benefit Plans Employers: 2001 56%, 2004 58%, 2006 61%, 2008 56%, 2010 52%, 2012 33%, 2014 33%, 2016 23%, 2018 30%, 2022 30%. Employees: 2001 80%, 2004 88%, 2006 65%, 2008 84%, 2010 82%, 2012 71%, 2014 75%, 2016 72%, 2018 64%, 2022 73%.