
Key findings
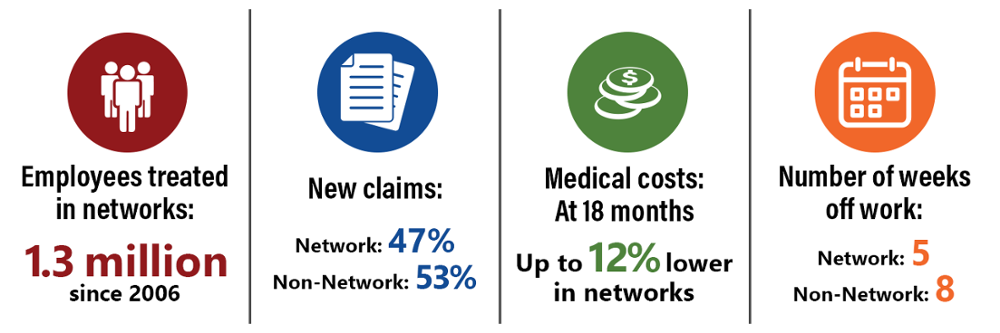
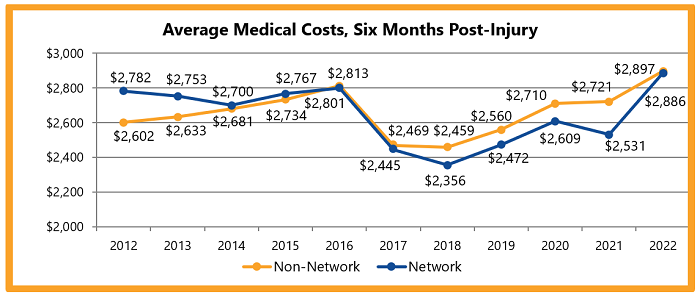
From 2012 to 2016, networks had higher average medical costs per claim for initial care, compared to non-network claims. Since 2017, non-network average medical costs per claim at six months post-injury had been approximately 4 percent higher on average than network claims. The difference narrowed in 2022. Networks’ average medical costs increased 14% in 2022.
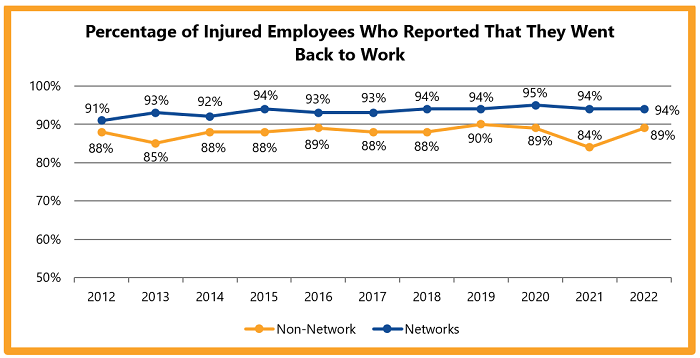
Since 2012, network claims consistently report higher return-to-work rates than non-network claims.
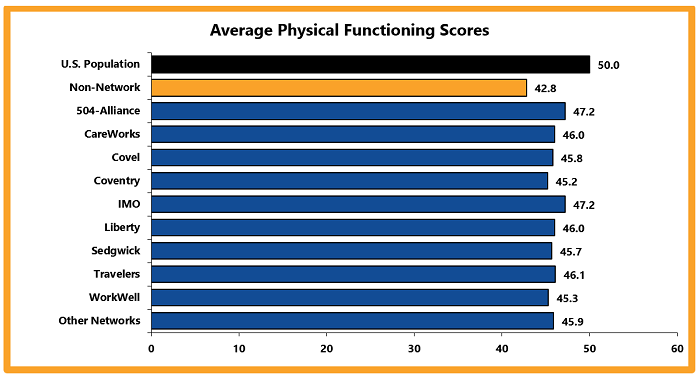
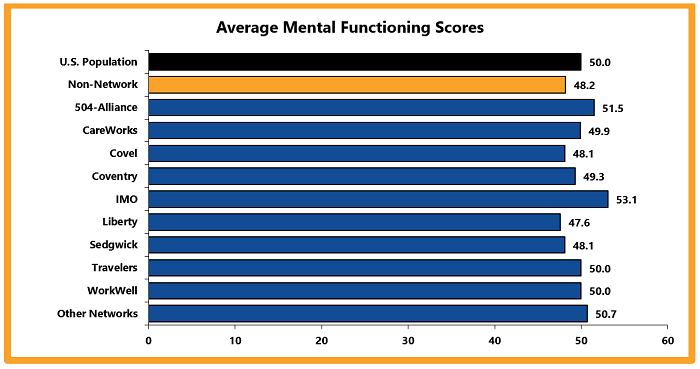
Physical functioning measures a person’s ability to do everyday tasks. Mental functioning measures a person’s ability to think and reason.
In 2022, network claims mostly reported higher physical and mental functioning scores than non-network claims. This generally means that injured employees who received network medical care reported better physical functioning and quality of life outcomes than non-network injured employees.